Lithium-ion batteries
Lithium-ion batteries got a whirlwind introduction on the front page; let's now return to them with real numbers. They are a particularly friendly application for the approach, since all the action happens in the electrodes and the electrolyte serves merely as a channel for carrying lithium ions. (Many other battery types are messier, with the solvent playing an active role in the key reaction; the lead-acid battery goes so far as to consume its sulfuric acid electrolyte.)
Both the negative (anode) and positive (cathode) electrodes in a lithium-ion battery are typically intercalation electrodes, where mobile ions may enter and mingle with mobile electrons. With both carriers coexisting in the one material, an electrode acts as a capacitor strung straight between its and rails, the chemical capacitance we just met. Charging it means intercalating more lithium, banking a and an together, and every bit stored slides the gap . Unlike the fixed steps at the earlier electrodes, this gap is no material constant: it grows as lithium loads into the host, along a curve set by the host material, so it tracks the state of charge. The sliding gap is just the chemical capacitance being nonlinear.
(Alternatively, you can view the stored lithium as neutral: the two carriers combine, , so the gap becomes that neutral lithium's chemical potential, . In truth the host holds nearly fully ionized lithium with its electrons delocalized around it, not neutral atoms, but the distinction is thermodynamically empty.)
With that, let's draw the electrochemical species band diagram for a whole cell:
A graphite-NMC cell at open circuit, built from real measured OCV curves. With everything at equilibrium, runs perfectly flat from electrode to electrode, and the cell voltage is set by the two steps : each electrode's own OCV. The capacitor symbols stand where the ⇌ markers of the previous topic would go: intercalation () pins no fixed gap; it banks charge and slides. Drag the state of charge to move lithium between the hosts and watch both steps evolve, graphite creeping through its staircase of plateaus, with the cell-voltage readout tracking the difference.
On the left is the negative electrode, whose intercalation host is graphite; on the right (positive) electrode, the host is nickel manganese cobalt oxides (NMC for short). Many other host materials exist (the front page's cell paired graphite with iron phosphate instead), but the graphite-NMC cell will be our worked example.
In the middle is the electrolyte-filled separator. Its job is simple: let ions flow smoothly (keeping flat), and let nothing else through, in particular no electrons (hence the break in ). To allow an appreciable density of , the electrolyte also contains counterions () to maintain charge neutrality; they are not consumed at the electrodes and play no direct role in the reaction, though their transport does matter, as we will see below.
The step is hugely different on the two sides, reflecting how weakly graphite binds its lithium compared to NMC; the difference between the two steps is exactly the voltage of the cell. The steps also move with the state of charge: at a nominal 0% charge most of the lithium sits in the NMC (raising its ), while at 100% most of it has moved into the graphite (raising that instead). This is the capacitor from the intro made concrete: each electrode's whole charge capacity is banked by taking up lithium, and every stored (with its electron) shifts the local gap.
In the lithium-ion battery field, the step size is known as the electrode's OCV (open-circuit voltage, against a reference). Technically , but since we're assuming , this is simply . The curves in the figure above are real measured OCVs.[1]
Battery discharge
During discharge, the output voltage always sags below the equilibrium value for the current state of charge, and for rapid discharges (draining the full capacity in under an hour) the sag becomes substantial. With the picture, we can attribute this external voltage drop, piece by piece, to a sum of internal drops.
First, a look at the actual structure inside a lithium-ion battery. Both electrodes are porous, sort of resembling a compressed powder soaked in electrolyte:
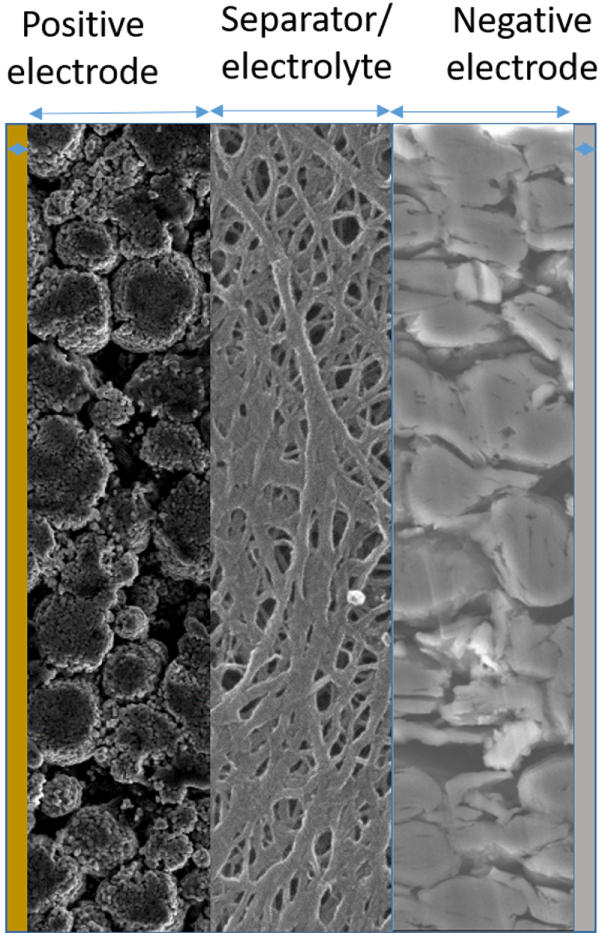
From Chen et al. 2020, license: Creative Commons Attribution Non-Commercial No Derivatives 4.0
This porous structure is quite beneficial: lithium ions move far more easily through the electrolyte than through the solid electrode materials, so ample electrolyte channels spare the ions a long journey through solids. Around the anode particles there is also a thin film called the SEI (solid electrolyte interphase), a passivation layer that keeps the strongly reducing lithiated graphite from continuously destroying the solvent. (The cathode grows an analogous film, the CEI, usually thinner and less consequential.)
Still, the particles are not so small that the lithium diffusion inside them can be neglected, and our band diagrams can show this too. Here is an anode particle during discharge ( being sucked out of it), with the -axis now representing a radial coordinate:
This shows dropping for two reasons: the slow diffusion of within the graphite particle itself, and the slow passage through the SEI layer at its surface. In contrast, stays quite flat, since graphite conducts electrons well. The gap carries information too: moving outward, shrinks, and since this gap tracks the local lithium content, the particle's surface is more depleted of lithium than its core.
That is still not the whole story: a full picture requires the voltage drops in the electrolyte and in the cathode too, and each particle sees different conditions depending on where it sits in the electrode. The following landscape comes out of a realistic battery simulation that captures all of this:
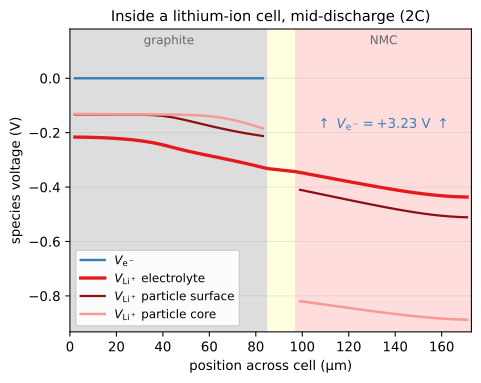
Internal voltages during a 2C discharge, at around 40% remaining capacity. Simulation done with DFN model in PyBaMM and converted to , values. The conversion recipe (which turns out to be surprisingly short) and full source code are in the companion notebook.
In this landscape, dissipation has nowhere to hide: would be perfectly flat at equilibrium, so every variation in it is some resistance mechanism at work, each one localized and readable. In the optional discussion below, we'll dig into these mechanisms one by one.
Takeaways
At equilibrium, the lithium-ion cell is about as simple as an ESBD gets: just two levels, and , with each electrode's OCV directly visible as its local step (its electrode potential against a reference).
During charge and discharge, the same two levels become a map of the "internal resistance": every drop in or is a specific dissipation mechanism, located and quantified.
Before we dive into specific materials, the next page is a quick field guide to the diagrams themselves — every line and symbol, collected in one place now that you've met them in context. After that, we look at how concentrations, activities, and standard states () define the voltage landscape in solutions.
NEXT TOPIC: How to read an ESBD
Optional discussion
More about the battery simulation mechanisms and results; click to open.
The higher the discharge rate, the more serious the various voltage drops become. I simulated a battery being discharged at the quite high rate of "2C", meaning it goes from 100% to 0% charge in just 30 minutes.
Let's zoom in on the variations:
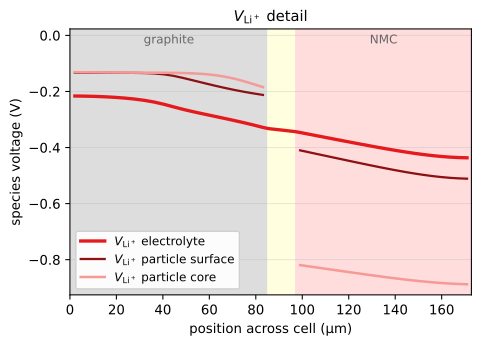
Again, this is a snapshot from midway through the discharge, when about 40% of the capacity remains.
Anode
At the leftmost part of the plot, is equal between the core and surface of the particles: these graphite particles are uniformly lithiated, barely used at all yet.
Moving right, the surface drops away, marking particles that are being heavily delithiated, and as we approach the separator even the core has dropped: those particles are being fully drained.
Notice also the roughly constant gap between the surface and the electrolyte's , present even at the barely-used particles. The model uses an "activation" type of equation (interface kinetics) for the moving between particle and electrolyte, so even a tiny current costs a significant step, while a slight further increase buys a much larger current.
Electrolyte
Within the electrodes, the electrolyte's shows significant gradients: the dissolved lithium ions have to work their way through the narrow and twisty spaces between the particles. Across the middle separator region it flattens out; the separator is porous too, but its pores are bigger and let the ions pass more easily.
Another aspect (not very visible here) is a concentration gradient in the electrolyte, which further reduces the conductivity on the cathode side. The culprit is a depletion of the more mobile counterion (), rather than anything about the ions themselves; this two-ion transport effect is covered in the transport topic.
Cathode
Unlike the anode, no part of the cathode is 'untouched'. Instead there is a vast difference in between surface and core throughout, the signature of very slow diffusion inside each particle. As a consequence, the surfaces of the near-separator particles have essentially saturated with lithium, and incoming lithium passes them by for particles deeper in.
Charging
During charging, many of the same voltage drops appear in reverse, and a new hazard appears with them: wherever rises above , we have , and it becomes thermodynamically favourable to precipitate out solid lithium metal. This "lithium plating" is a serious problem that limits fast charging. The lithium typically comes out as needles and dendrites, and only some of it manages to re-dissolve later: any chunk that loses its electronic connection becomes "dead lithium", its internal and falling together to the ambient electrolyte's , out of the charger's reach.
Adopted from Chen et al. 2020, "Development of Experimental Techniques for Parameterization of Multi-scale Lithium-ion Battery Models": Equations 8 and 9, which are fits to Figure 12. ↩︎